OUR WORLD DEPENDS ON ENERGY

Every consumer product imaginable, be it a smart phone, tablet, television, oven, refrigerator, automobile, as well as our heating and cooling systems at work and at home, all rely on energy to operate. Public transportation, airlines, and all manner of social investment depend on energy to get us to work, to our places of recreation, and to families spread all over the world.
There are many forms and definitions for energy. Our business model embraces energy as electricity and fuel.
ENERGY AND POPULATION
Our world population is growing at a rate of 1.14% per year;(1) the average population change is currently estimated at around 80 million per year. According to the United Nations, world population reached 7 Billion on October 31, 2011. The US Census Bureau made a lower estimate, for which the 7 billion mark was actually reached on March 12, 2012. According to the most recent United Nations estimates, the human population of the world is expected to reach 8 billion people in the spring of 2024.(1)
Annual growth rate reached its peak in the late 1960s, when it was at 2% and above. The rate of increase has therefore almost halved since its peak of 2.19 percent, which was reached in 1963.(1)
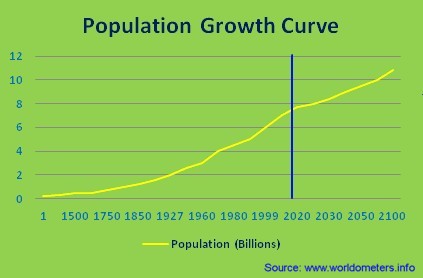
The annual growth rate is currently declining and is projected to continue to decline in the coming years. Currently, it is estimated that it will become less than 1% by 2020 and less than 0.5% by 2050.(1)
This means that world population will continue to grow in the 21st century, but at a slower rate compared to the recent past. World population has doubled (100% increase) in 40 years from 1959 (3 billion) to 1999 (6 billion). It is now estimated that it will take a further 43 years to increase by another 50%, to become 9 billion by 2042.(1)
The latest United Nations projections indicate that world population will nearly stabilize at just above 10 billion persons after 2062.(1)
However, as technology continues to evolve, so does the demand for increased quality of life, worldwide.
As this world population and its demands increase, the demand for energy will increase to satisfy this growth and demand.
XUN PLANS TO BE THERE IN THIS DEVELOPING GROWTH!
ENERGY DEMAND
 XUN IS FOCUSED ON SERVICING THE ENERGY NEEDS OF THE WORLD
ENERGY comes in all forms and for our discussions, we refer to energy in terms of a measureable unit such as equivalent to a tonne of oil (TOE). One TOE is equal to 11.63 megawatt hours of electricity or 39,683,205.4 BTU.
During 2013, the world consumed 12,730.43 million TOE as compared to 9,943.82 million TOE for 2003 and 8,256.30 million TOE in 1993.(2) Over a two decade period, our energy demand increased by 154%. BP's 2014 edition of BP’s Energy Outlook states: "We project that global energy consumption will rise by 41% by 2035, with 95% of that growth coming from rapidly growing emerging economies.”(3)
Primary energy demand increases by 41% between 2012 and 2035, with growth averaging 1.5% per annum (p.a.). Growth slows, from 2.2% p.a. for 2005-15, to 1.7% p.a. 2015-25 and just 1.1% p.a. in the final decade.(3)
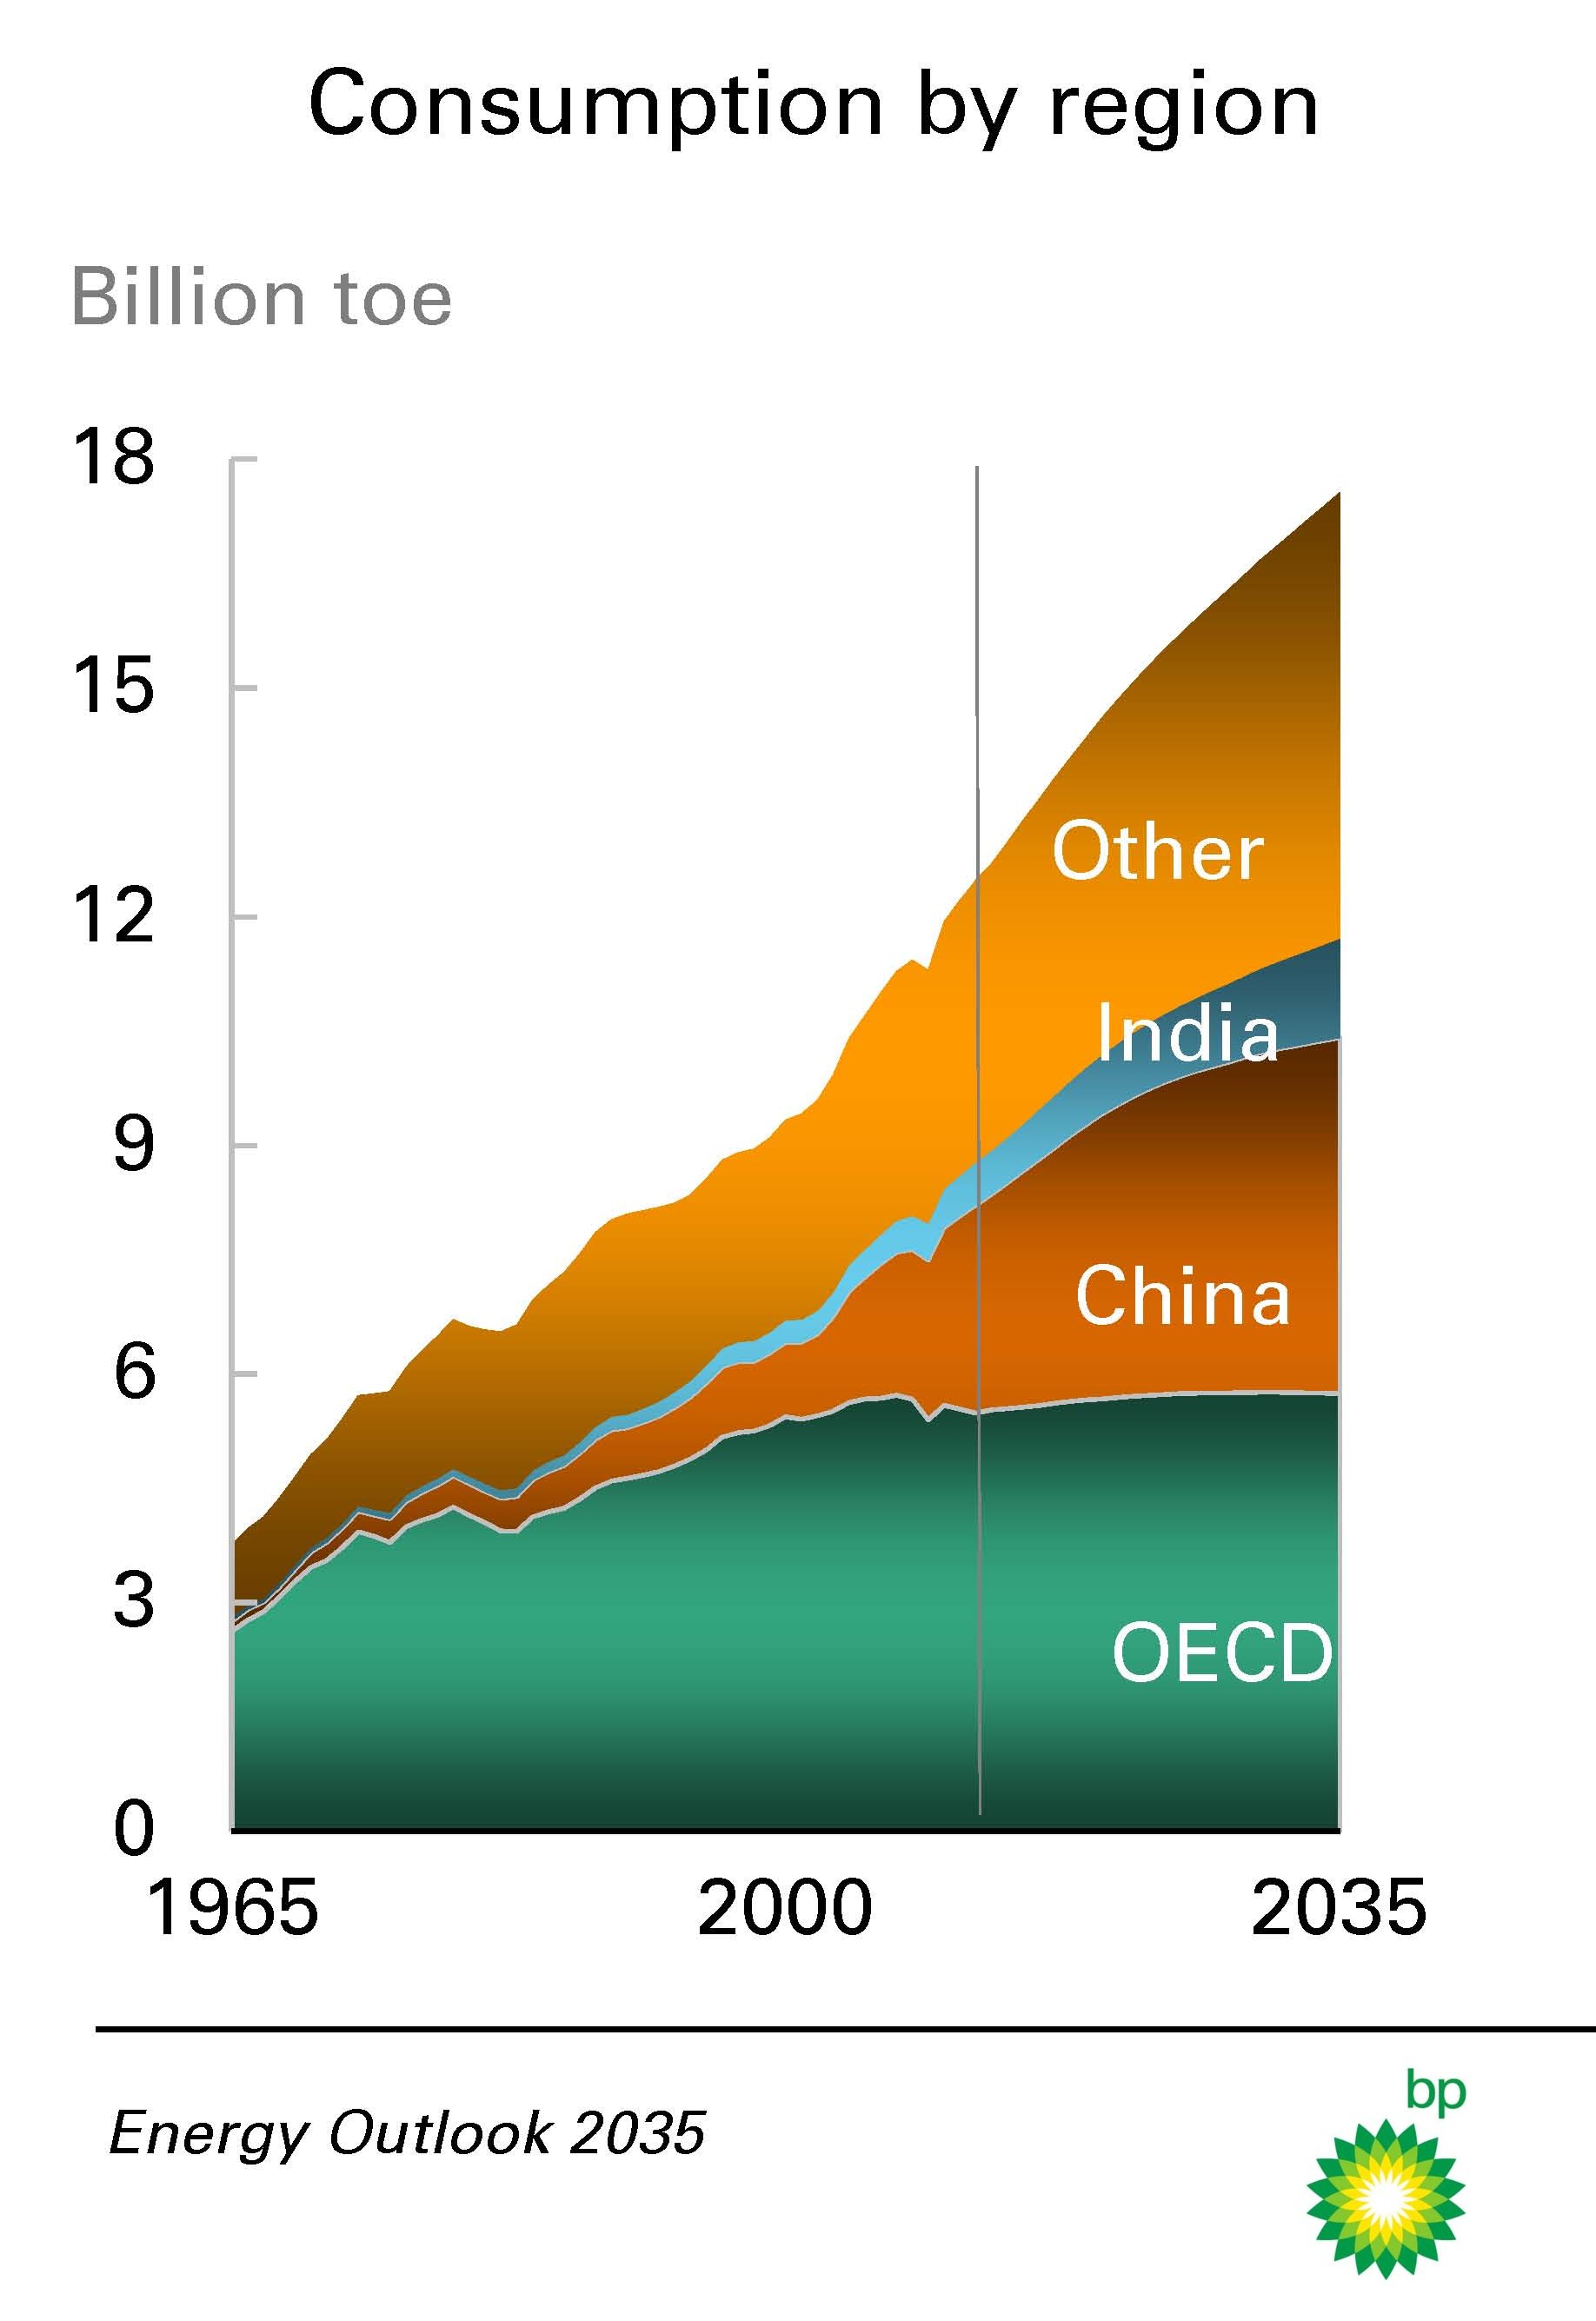
We are leaving a phase of very high energy consumption growth, driven by the industrialization and electrification of non-OECD (The Organization for Economic Co-operation and Development) economies, notably China. The 2002-2012 decade recorded the largest ever growth of energy consumption in volume terms over any ten year period, and this is unlikely to be surpassed in our timeframe.(3)
There is a clear long-run shift in energy growth from the OECD to the non-OECD. Virtually all (95%) of the projected growth is in the non-OECD, with energy consumption growing at 2.3% p.a. 2012-35. OECD energy consumption, by contrast, grows at just 0.2% p.a. over the whole period and is actually falling from 2030 onwards.(3)
There is a clear long-run shift in energy growth from the OECD to the non-OECD. Virtually all (95%) of the projected growth is in the non-OECD, with energy consumption growing at 2.3% p.a. 2012-35. OECD energy consumption, by contrast, grows at just 0.2% p.a. over the whole period and is actually falling from 2030 onwards.(3)
China has emerged as the key growth contributor, but by the end of the forecast, China’s contribution is starting to fade. India’s contribution grows, almost matching that of China in the final decade of the forecast.(3)
XUN PLANS TO BE IN THESE REGIONS DEVELOPING THIS GROWTH!
WHAT IS THE ENERGY CONSUMPTION BEING USED FOR
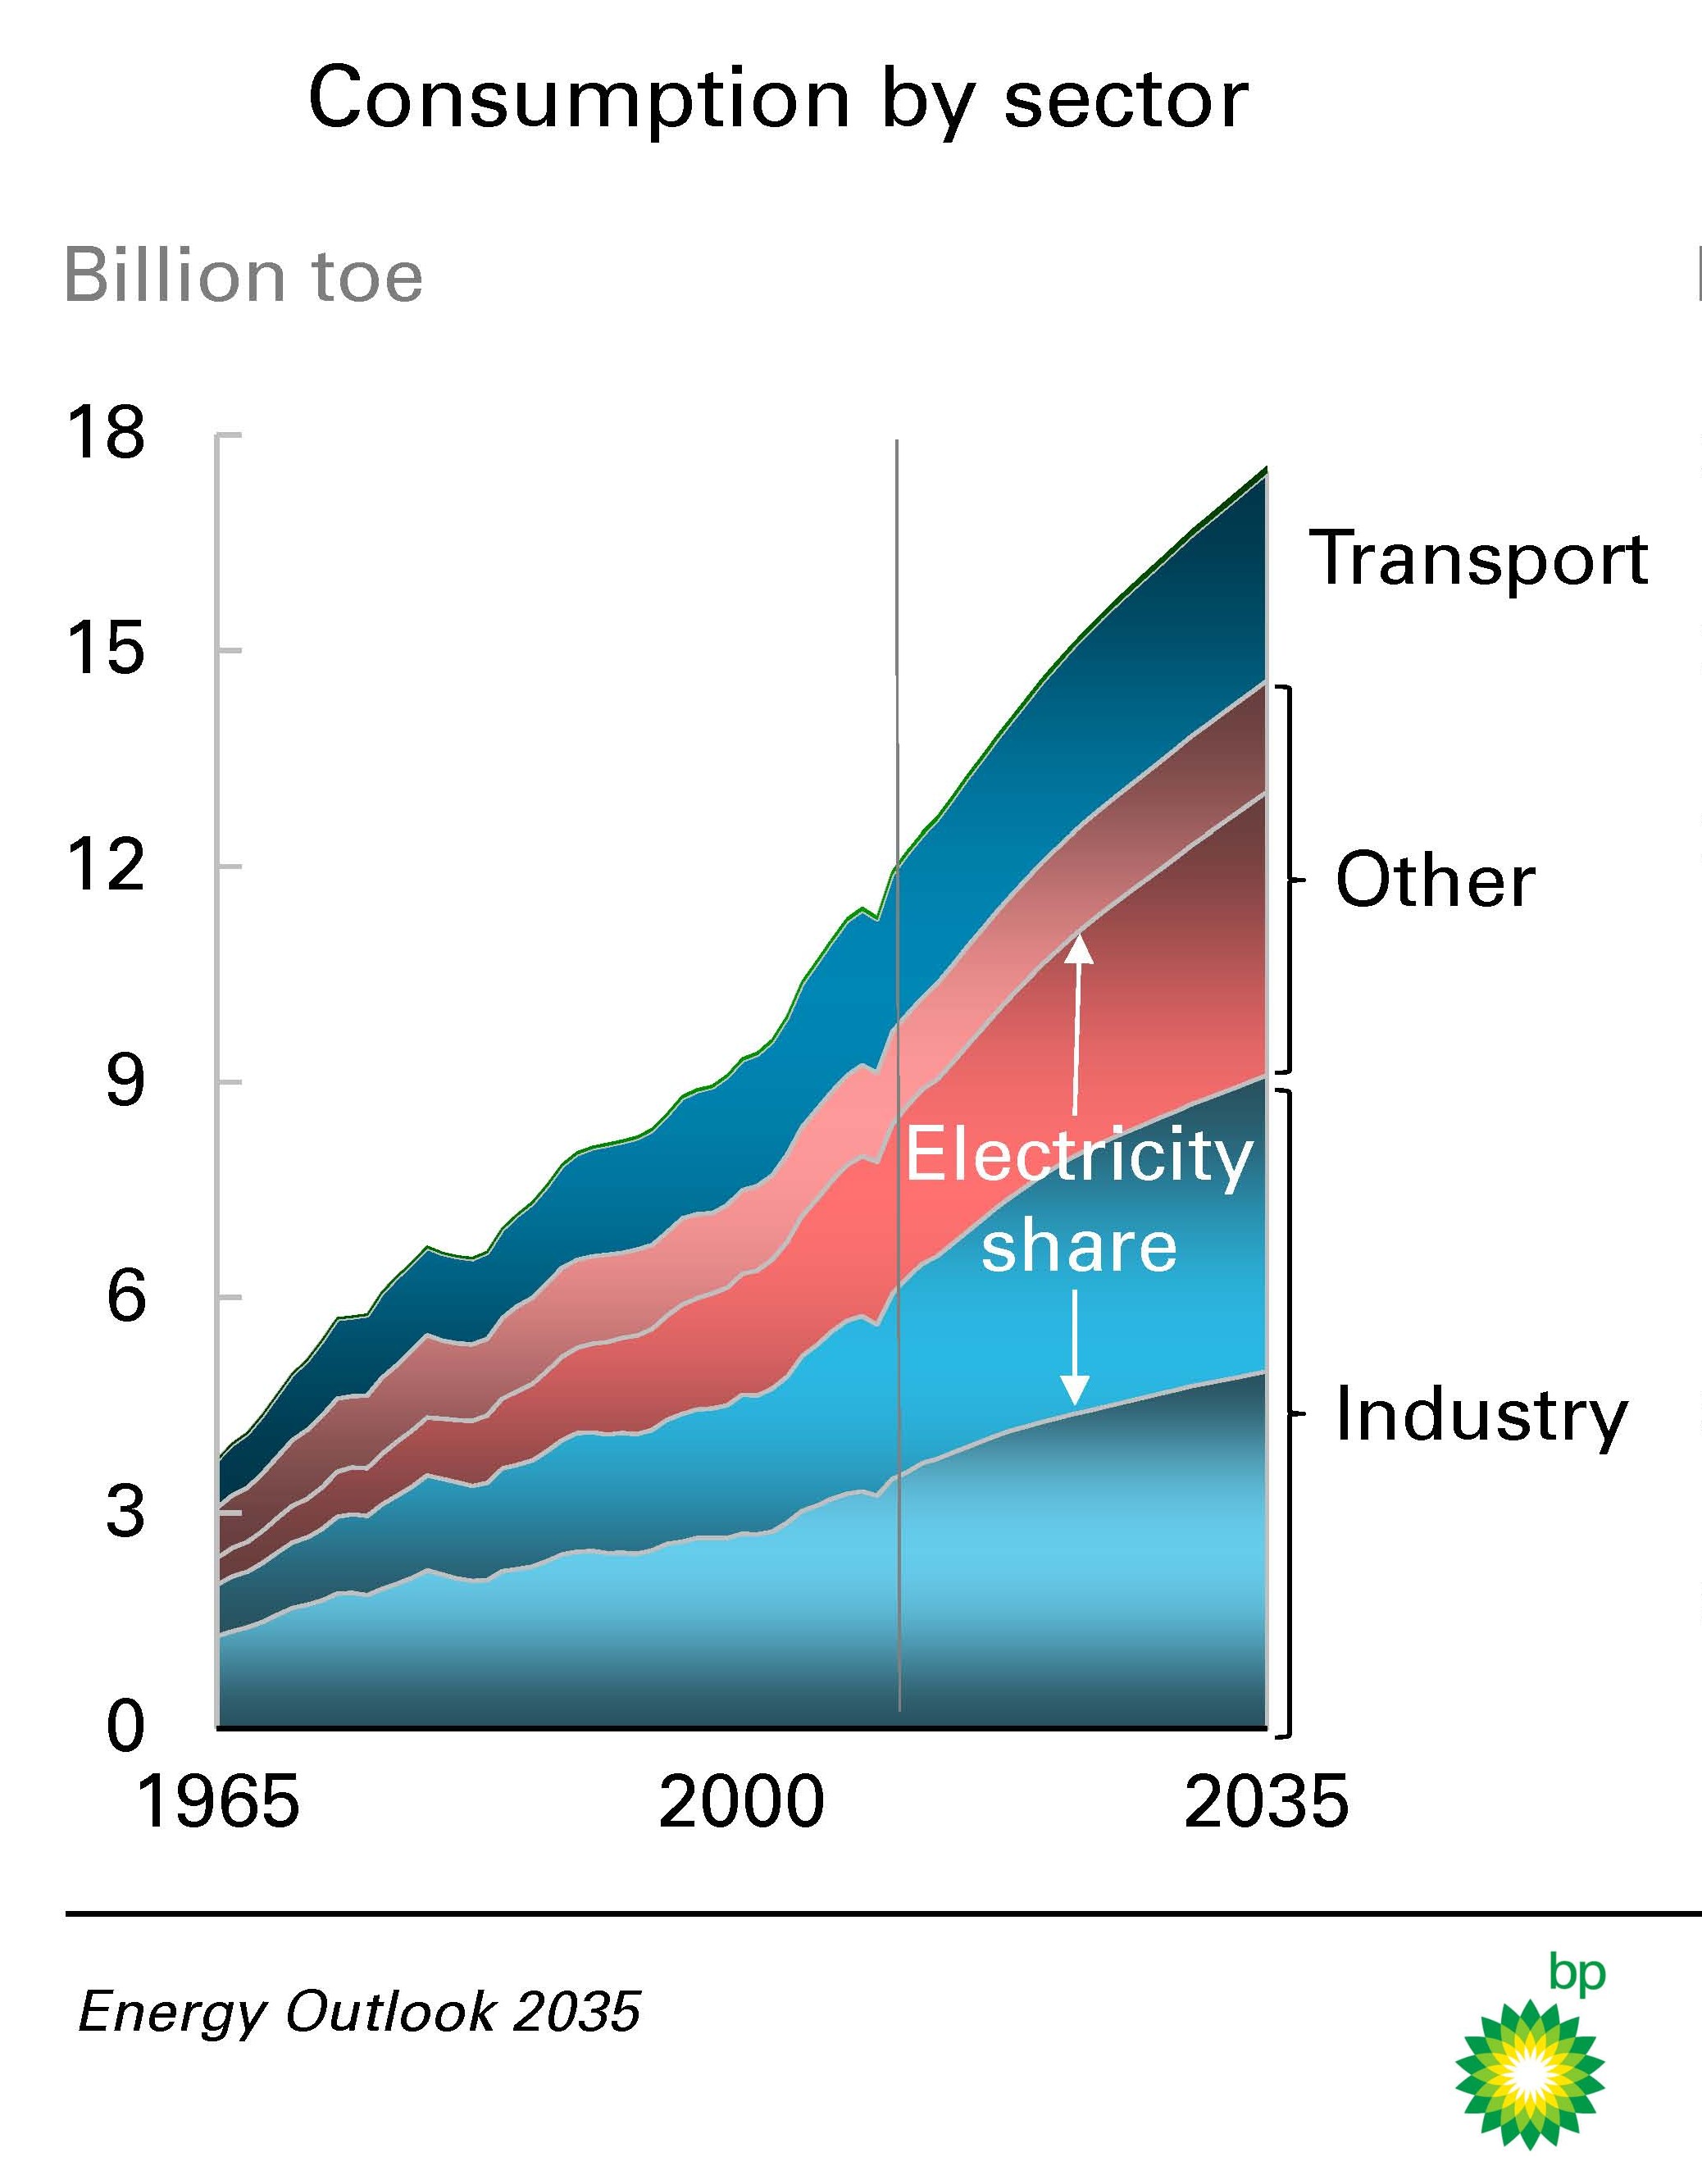
By sector, industry remains the dominant source of growth for primary energy consumption, both directly and indirectly (in the form of electricity). Industry accounts for more than half of the growth of energy consumption 2012-35. This reflects the unprecedented pace and scale of industrialization in Asia.
Energy for industry grows at 2.6% p.a. over the decade 2005-15, but this slows to just 1.0% p.a. in the final decade of the forecast as China’s rapid industrialization comes to an end.(3)
The next major component of growth is energy used in the ‘other’ sector (residential, services and agriculture), predominantly in the form of electricity. By the final decade, growth in other sector energy use almost matches industry in volume terms.(3)
The transport sector continues to play a relatively small role in primary energy growth throughout the forecast, growing steadily but accounting for just 13% of total growth during 2012-35.(3)
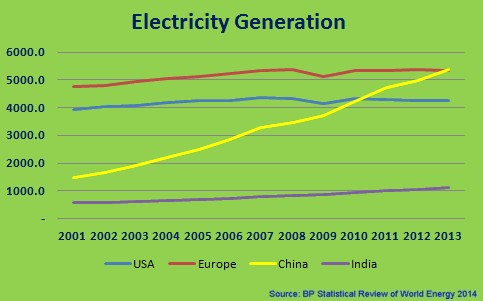 One of the longest established trends in energy is the increasing role of the power sector. The share of primary energy devoted to power generation rises in industrializing as well as in mature economies, where growth is dominated by the service sector.(3)
In 2012, 42% of primary energy was converted into electricity in the power sector, up from 30% in 1965. By 2035 that share will rise to 46%.(3)
Fuels for power generation account for 57% of the growth in primary energy consumption 2012-35. And the power sector is the one place where all the fuels compete.(3)
FROM ELECTRICITY GENERATION TO ELECTRICITY STORAGE AND OPTIMIZATION, XUN PLANS TO BE THERE, DEVELOPING ELECTRICAL FACILITIES.
XUN OIL MARKETING DIVISION
XUN Oil Marketing (XOM) is a global physical commodity trading firm with an emphasis on energy commodity transactions.
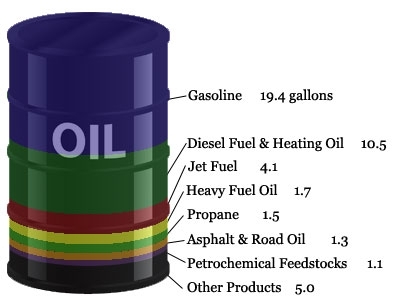
- XOM offers a full range of petroleum products including but not limited to the following:
- Aviation Jet Fuel
- Crude Oil (all standard types & grades)
- Diesel (all standard grades)
- Fuel Oil
- Gasoline(all octanes)
- LNG
- LPG
- Marine Diesel(MDO)
- Mazut
- Other Petroleum Products
-
In addition to the full range of petroleum products, XOM also will market products including but not limited to the following industries:
-
Agriculture
-
Automotive
-
Construction
-
Infrastructure
-
Energy
-
XOM has established nine districts within the XOM network in just twelve months:
-
North America (NAD)
-
Latin America including Central America (LAD)
-
North West Europe (NWED)
-
East Europe (EED)
-
Middle East and North Africa (MENAD)
-
Africa excluding North Africa (AFD)
-
South East Asia (SEAD)
-
China (CHID)
-
Russia (RUSD)
WHY CRUDE OIL DERIVATIVES
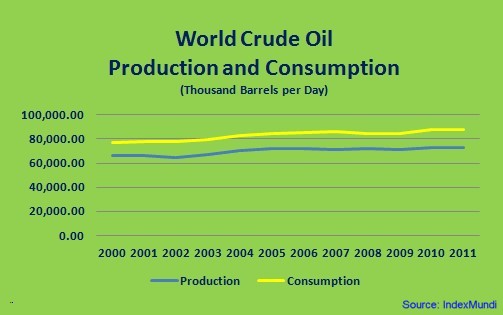 Crude Oil - the world’s most actively traded commodity. More than 32 billion barrels of crude oil are consumed annually worldwide. It exists in liquid form under normal temperatures and pressure and its physical characteristics are highly variable. From transport fuels like gasoline, diesel and jet fuel, and heating oil such as kerosene, to its refined by-products found in chemicals and plastics as well as many lubricants, waxes, tars, asphalts and even pesticides, the world-wide demand for crude oil is one that will only increase as the world’s nations continue to seek to expand their quality of life.
It is estimated that by 2030 the worldwide demand for crude oil will reach approximately 318 million barrels per day.(4)
Further, estimations suggest that within the next five years nearly half of all global crude oil demand growth will come from China with this trend set to continue until 2035.(5)
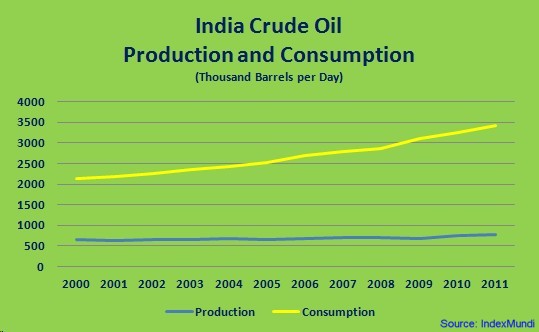 Similarly, The U.S. Energy Information Association (EIA) projects India’s demand for crude oil will more than double from its present 3.7 million barrels per day to 8.2 million by 2040 with its domestic production remaining relatively low at only 1 million barrels per day. With this level of dependence on imported crude oil, both China and Indian have had to diversify their supply sources and rapidly increase their imports of foreign crude oil.(6)
XUN PLANS TO BE A SUPPLIER OF OIL PRODUCTS TO INDIA & CHINA
THE UNITED STATES MARKET
Conversely, the U.S. has long been known to have vast amounts of low level crude oil and gas but no practical way to harvest it. Until recently that is: Fracking—the process of injecting liquid at high pressure into subterranean rocks, boreholes, etc., so as to force open existing fissures and extract crude oil or gas—is being touted as the way to the next “energy boom” in the United States. By using this new technology, shale deposits all over the United States are being opened to allow for production of crude oil and gas never seen in the U.S. before thereby increasing or guaranteeing even the likelihood of these precious commodities being exported worldwide.
The Bakken crude oil shale area in North Dakota for example has enough crude oil to run the entire country for 20 years. According to a study released by the state of North Dakota it is estimated that there are 2.1 billion barrels (330,000,000 m3) of technically recoverable crude oil in the Bakken.(7)
Moreover, The Bakken is just one of more than eighteen shale basins in the United States, exceeding a combined total of 136,081 square miles of technically recoverable resources, or TRR, in crude oil and gas.(8)
Then there’s Texas! Texas, with its fracking and traditional drilling, presently produces more crude oil than some OPEC nations. According to the U.S. Energy Information Association, in just five years, crude oil production in Texas has more than doubled from 1.1 million barrels of crude oil per day in 2008 to more than 2.5 million barrels per day in 2013.(9) In 2013 alone, Texas produced 35 percent of all the U.S. crude oil, but the state is projected to become the world’s second largest crude oil producer by the end of this year — second only to Saudi Arabia.
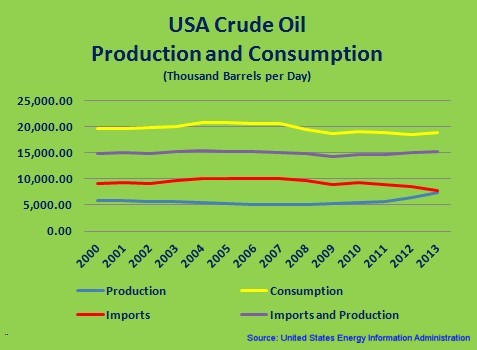 Based on United States EIA statistics, the USA is consuming more oil products than can be produced from the crude oil that is produced and imported. The difference for 2013 was an average of 3,769,000 barrels per day shortage which is made up through imports of refined oil products into the United States.
According to San Antonio, Texas WOAI local news, Texas Railroad Commissioner David Porter told an Eagle Ford conference that the biggest concern is that more crude oil is being produced than can be refined, given the fact that U.S. refineries are now working at full production:
"That's one of the reasons why a number of people in the industry and I have called on the federal government to reconsider limitations on exports of American oil…"(10)
Although the demand for imported crude oil by various nations and the restrictions on U.S. domestic production are great, savvy, earnest and imaginative business minds are working to implement what is required to successfully negotiate and solidify long-term, multi-faceted partnerships with international buyers as well as domestic investors, producers and policy makers in order to capitalize on what is projected to be the next U.S. “energy boom”.
XUN PLANS TO PARTICIPATE IN THE MARKET OF IMPORTING BOTH CRUDE OIL AND REFINED PETROLEUM PRODUCTS TO MEET THE USA CONSUMPTION NEEDS.
ONE SUCH MIND
With more than forty years combined experience in the business world of energy & commodities as well as possessing a talent for accurate projections and outcomes based on numbers and statistics and an award winning Chief, our President and CEO, Jerry G. Mikolajczyk expanded his vision for XUN endeavoring to ultimately incorporate multiple branches of the parent company, XUN as a means of embracing the vast number of opportunities available to help make XUN a leader in the world of crude oil and energy. This is evidenced in his interview with Michael Norman on March 7, 2012, link: VIDEO: JERRY G. MIKOLAJCZYK SAYS TO GO LONG NAT GAS
XOM—utilizing the same drive and commitment to excel as Mr. Mikolajczyk possessed since his youth (such that allowed him to be the first in Alberta, Canada to graduate from high school in just 2 ½ years), is driving the XOM progress from brokering deals in October 2013 to initiating the business model of XOM being a title holder in April 2014.
Aggressively negotiating with Ready, Willing & Able buyers, sellers and financiers, Mr. Mikolajczyk has developed a business model which has successfully completed its first physical commodity trade of 200,000 metric tonnes of Mazut of a 2.4 Million tonne, 12 month, purchase and supply contract with no financial risk to XUN.
With worldwide growth and expansion ensuring a constant demand for crude oil based products, XOM and its parent company XUN plan to be leaders in helping to satisfy this demand.
Recently stated in a closed-door meeting, Mr. Mikolajczyk pointed out to potential investors:
“Energy demand will not decline unless mankind invents a new form of energy…energy demand will be increasing constantly as the populations of the world increases.”
Mr. Mikolajczyk understands that as the world’s demand for energy products continue to increase coupled with the rapid pace at which technology is being created to assist in meeting these demands, in order to successfully posture XUN as a leader of the way, XUN’s focus must be equally upon successful business at home and abroad.
Through the leadership of our President & CEO, Jerry G. Mikolajczyk, we expect the exponential growth of XUN to pave the way to becoming a vertically integrated company with a rapid evolution to autonomy in the world of energy.
CREATIVE AND INNOVATIVE FINANCING AT ITS BEST!
. . . XUN IS ENERGY . . .
. . . . . ENERGY IS SYNERGY . . . . .
. . . . . . . SYNERGY IS XUNERGY . . . . . . .
Safe Harbor:
This website page contains forward-looking statements, particularly those regarding global economic growth, population growth, energy consumption, policy support for renewable energies and sources of energy supply. Forward-looking statements involve risks and uncertainties because they relate to events, and depend on circumstances, that will or may occur in the future. Actual outcomes may differ depending on a variety of factors, including product supply, demand and pricing; political stability; general economic conditions; legal and regulatory developments; availability of new technologies; natural disasters and adverse weather conditions; wars and acts of terrorism or sabotage; and other factors discussed elsewhere in this presentation.
The statements contained on this website page may not be historical fact, are forward-looking statements (as such term is defined in the Private Securities Litigation Reform Act of 1995), within the meaning of Section 27A of the Securities Act of 1933, as amended (the “Securities Act”), and Section 21E of the Securities Exchange Act of 1934, as amended (the “Exchange Act”). The forward-looking statements contained herein are based on current expectations that involve a number of risks and uncertainties.
These statements can be identified by the use of forward-looking terminology such as “believes,” “expects,” “may,” “will,” “should,” "projects", "plan" or “anticipates,” or the negative thereof or other variations thereon or comparable terminology, or by discussions of strategy that involve risks and uncertainties. The Company wishes to caution the reader that its forward-looking statements that are historical facts are only predictions. No assurances can be given that the future results indicated, whether expressed or implied, will be achieved. While sometimes presented with numerical specificity, these projections and other forward-looking statements are based upon a variety of assumptions relating to the business of the Company, which, although considered reasonable by the Company, may not be realized. Because of the number and range of assumptions underlying the Company’s forward-looking statements, many of which are subject to significant uncertainties and contingencies that are beyond the reasonable control of the Company, some of the assumptions inevitably will not materialize, and unanticipated events and circumstances may occur subsequent to the date of this report.
These forward-looking statements are based on current expectations and the Company assumes no obligation to update this information. Therefore, the actual experience of the Company and the results achieved during the period covered by any particular forward-looking statements may differ substantially from those projected. Consequently, the inclusion of forward-looking statements should not be regarded as a representation by the Company or any other person that these estimates and projections will be realized. The Company’s actual results may vary materially. There can be no assurance that any of these expectations will be realized or that any of the forward-looking statements contained herein will prove to be accurate.
References
(1):
http://www.worldometers.info/world-population/#pastfuture
(2): BP Statistical Review Of World Energy 2014
(3): BP Energy Outlook Booklet 2035
(4): International Energy Agency. 1998 World Energy Outlook; IEA Publications: London.
(5): US Energy Information Administration; Independent Statistics & Analysis
(6): US Energy Information Administration; Release date August 2014
(7): ND study: 167 billion barrels of crude oil in Bakken
(8): International Energy Agency; Intek, Inc.; Review of Emerging resources
(9): U.S. Energy Information Association; Data; Crude & Other Liquids
(10): WOAI.com Articles; April 24, 2014